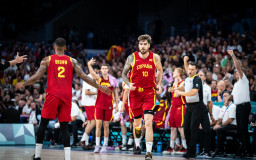
-
-
-
-
-
-
-
-
-
-
-
-
-
-
-
-
-
-
-
16:30
-
17:00
-
18:30
-
23:00
-
23:30
-
01:30
-
Thu
17:45
-
Thu
18:30
-
Thu
23:00
-
Fri
01:30
-
Fri
02:00
-
Fri
17:00
-
Fri
18:30
-
Fri
23:00
-
Sat
00:00
-
Sat
01:30
-
Sat
17:00
-
Sat
19:30
-
Sat
22:00
-
Sun
00:30
-
Sun
17:00
-
Sun
19:30
-
Sun
23:00
-
Mon
01:30
-
04-29
02:00 -
04-29
18:30 -
04-29
19:00 -
04-30
17:00 -
04-30
18:45 -
05-01
18:30 -
05-01
19:00 -
05-02
18:30 -
05-02
18:45
- Summary
- Statistics
 Orlando Magic Orlando Magic |
||

Nikola Vucevic |
Points | 19 |
| Accuracy |
6-16
38 % |
|
| Rebounds | 13 | |
| Assists | 1 | |
| Steals | 2 | |
| Efficiency | 22 | |
Indiana Pacers  |
||
| 27 | Points |
 Paul George |
|
10-19
53 % |
Accuracy | |
| 7 | Rebounds | |
| 3 | Assists | |
| 1 | Steals | |
| 22 | Efficiency | |
|
2025-04-11 Indiana Pacers |
129:115 | |
|
2025-04-13 Atlanta Hawks |
105:117 | |
|
2025-04-15 Atlanta Hawks |
120:95 | |
|
2025-04-20 Boston Celtics |
86:103 | |
|
2025-04-23 Boston Celtics |
||
|
2025-04-25 Boston Celtics |
||
|
2025-04-11 Orlando Magic |
115:129 | |
|
2025-04-13 Cleveland Cavaliers |
126:118 | |
|
2025-04-19 Milwaukee Bucks |
117:98 | |
|
2025-04-22 Milwaukee Bucks |
123:115 | |
|
2025-04-26 Milwaukee Bucks |
||
|
2025-04-28 Milwaukee Bucks |
||
| MIN | FGM-A | 2PM-A | 3PM-A | FTM-A | REB D-O | REB | AS | ST | TO | BS | PF | PTS | EFF | |
| Arron Afflalo | 34:05 | 3-10
30% | 2-7
29% | 1-3
33% | 0-2
0% | 3-0 | 3 | 1 | 1 | 0 | 0 | 3 | 7 | 0 FT-0 |
| Nikola Vucevic | 37:13 | 6-16
38% | 6-16
38% | 0-0
-% | 7-8
88% | 5-8 | 13 | 1 | 2 | 1 | 1 | 2 | 19 | 22 FT-28 |
| Glen Davis | 26:03 | 3-10
30% | 3-10
30% | 0-0
-% | 3-4
75% | 2-3 | 5 | 1 | 0 | 1 | 0 | 1 | 9 | 5 FT-9 |
| Tobias Harris | 33:19 | 5-13
38% | 5-11
45% | 0-2
0% | 3-3
100% | 5-0 | 5 | 1 | 0 | 1 | 0 | 3 | 13 | 7 FT-10 |
| Jameer Nelson | 23:54 | 3-4
75% | 1-1
100% | 2-3
67% | 0-0
0% | 3-0 | 3 | 2 | 0 | 2 | 0 | 1 | 8 | 9 FT-18 |
| Kyle O'Quinn | 10:47 | 1-1
100% | 1-1
100% | 0-0
-% | 0-0
0% | 6-0 | 6 | 1 | 1 | 0 | 0 | 2 | 2 | 8 FT-36 |
| Victor Oladipo | 33:18 | 8-18
44% | 7-17
41% | 1-1
100% | 6-7
86% | 4-0 | 4 | 4 | 2 | 4 | 0 | 2 | 23 | 16 FT-23 |
| Moe Harkless | 19:54 | 2-4
50% | 1-3
33% | 1-1
100% | 1-2
50% | 8-0 | 8 | 1 | 2 | 2 | 0 | 0 | 6 | 12 FT-29 |
| Andrew Nicholson | 8:28 | 2-4
50% | 2-3
67% | 0-1
0% | 0-0
0% | 1-0 | 1 | 0 | 0 | 1 | 0 | 0 | 4 | 2 FT-11 |
| E'Twaun Moore | 12:59 | 1-3
33% | 1-2
50% | 0-1
0% | 0-0
0% | 0-0 | 0 | 1 | 1 | 1 | 0 | 2 | 2 | -1 FT--4 |
| 240 | 34-83
41% | 29-71
41% | 5-12
42% | 20-26
77% | 37-11 | 48 | 13 | 9 | 13 | 1 | 16 | 93 | 80 |
| MIN | FGM-A | 2PM-A | 3PM-A | FTM-A | REB D-O | REB | AS | ST | TO | BS | PF | PTS | EFF | |
| Lance Stephenson | 39:27 | 6-11
55% | 4-7
57% | 2-4
50% | 2-3
67% | 8-1 | 9 | 3 | 2 | 5 | 0 | 1 | 16 | 18 FT-22 |
| George Hill | 29:54 | 5-11
45% | 3-6
50% | 2-5
40% | 0-0
0% | 4-0 | 4 | 7 | 0 | 1 | 0 | 3 | 12 | 13 FT-21 |
| David West | 32:42 | 5-12
42% | 5-12
42% | 0-0
-% | 4-6
67% | 3-1 | 4 | 1 | 0 | 1 | 0 | 3 | 14 | 6 FT-9 |
| Paul George | 35:22 | 10-19
53% | 5-11
45% | 5-8
63% | 2-2
100% | 7-0 | 7 | 3 | 1 | 3 | 0 | 4 | 27 | 22 FT-30 |
| Roy Hibbert | 34:11 | 3-4
75% | 3-4
75% | 0-0
-% | 0-0
0% | 5-2 | 7 | 3 | 0 | 3 | 4 | 4 | 6 | 12 FT-17 |
| Luis Scola | 15:18 | 1-6
17% | 1-6
17% | 0-0
-% | 0-0
0% | 5-0 | 5 | 1 | 1 | 0 | 0 | 0 | 2 | 4 FT-13 |
| Ian Mahinmi | 13:34 | 1-1
100% | 1-1
100% | 0-0
-% | 2-6
33% | 1-3 | 4 | 0 | 0 | 2 | 1 | 2 | 4 | 1 FT-4 |
| C.J. Watson | 18:21 | 2-7
29% | 1-4
25% | 1-3
33% | 1-2
50% | 0-0 | 0 | 1 | 1 | 0 | 1 | 2 | 6 | 1 FT-3 |
| Danny Granger | 21:11 | 2-8
25% | 1-4
25% | 1-4
25% | 0-0
0% | 1-0 | 1 | 0 | 1 | 0 | 0 | 1 | 5 | 0 FT-0 |
| 240 | 35-79
44% | 24-55
44% | 11-24
46% | 11-19
58% | 34-7 | 41 | 19 | 6 | 15 | 6 | 20 | 92 | 77 |
| FGM-A | 2PM-A | 3PM-A | FTM-A | REB D-O | REB | AS | ST | TO | BS | PF | PTS | EFF | |
| Orlando Magic | 34-83
41% | 29-71
41% | 5-12
42% | 20-26
77% | 37-11 | 48 | 13 | 9 | 13 | 1 | 16 | 93 | 80 |
| Indiana Pacers | 35-79
44% | 24-55
44% | 11-24
46% | 11-19
58% | 34-7 | 41 | 19 | 6 | 15 | 6 | 20 | 92 | 77 |
| Player of the Game | |

|
EFF
22
|
| Nikola Vucevic | |
| Points | 19 |
| Accuracy | 6-16 |
| Rebounds | 13 |
| Assists | 1 |
| Points | |

|
27 |
| Paul George | |
| Victor Oladipo | 23 |
| Nikola Vucevic | 19 |
| Lance Stephenson | 16 |
| David West | 14 |
| Rebounds | |

|
13 |
| Nikola Vucevic | |
| Lance Stephenson | 9 |
| Moe Harkless | 8 |
| Paul George | 7 |
| Roy Hibbert | 7 |
| Assists | |

|
7 |
| George Hill | |
| Victor Oladipo | 4 |
| Lance Stephenson | 3 |
| Roy Hibbert | 3 |
| Paul George | 3 |
| Steals | |

|
2 |
| Nikola Vucevic | |
| Lance Stephenson | 2 |
| Victor Oladipo | 2 |
| Moe Harkless | 2 |
| Arron Afflalo | 1 |
